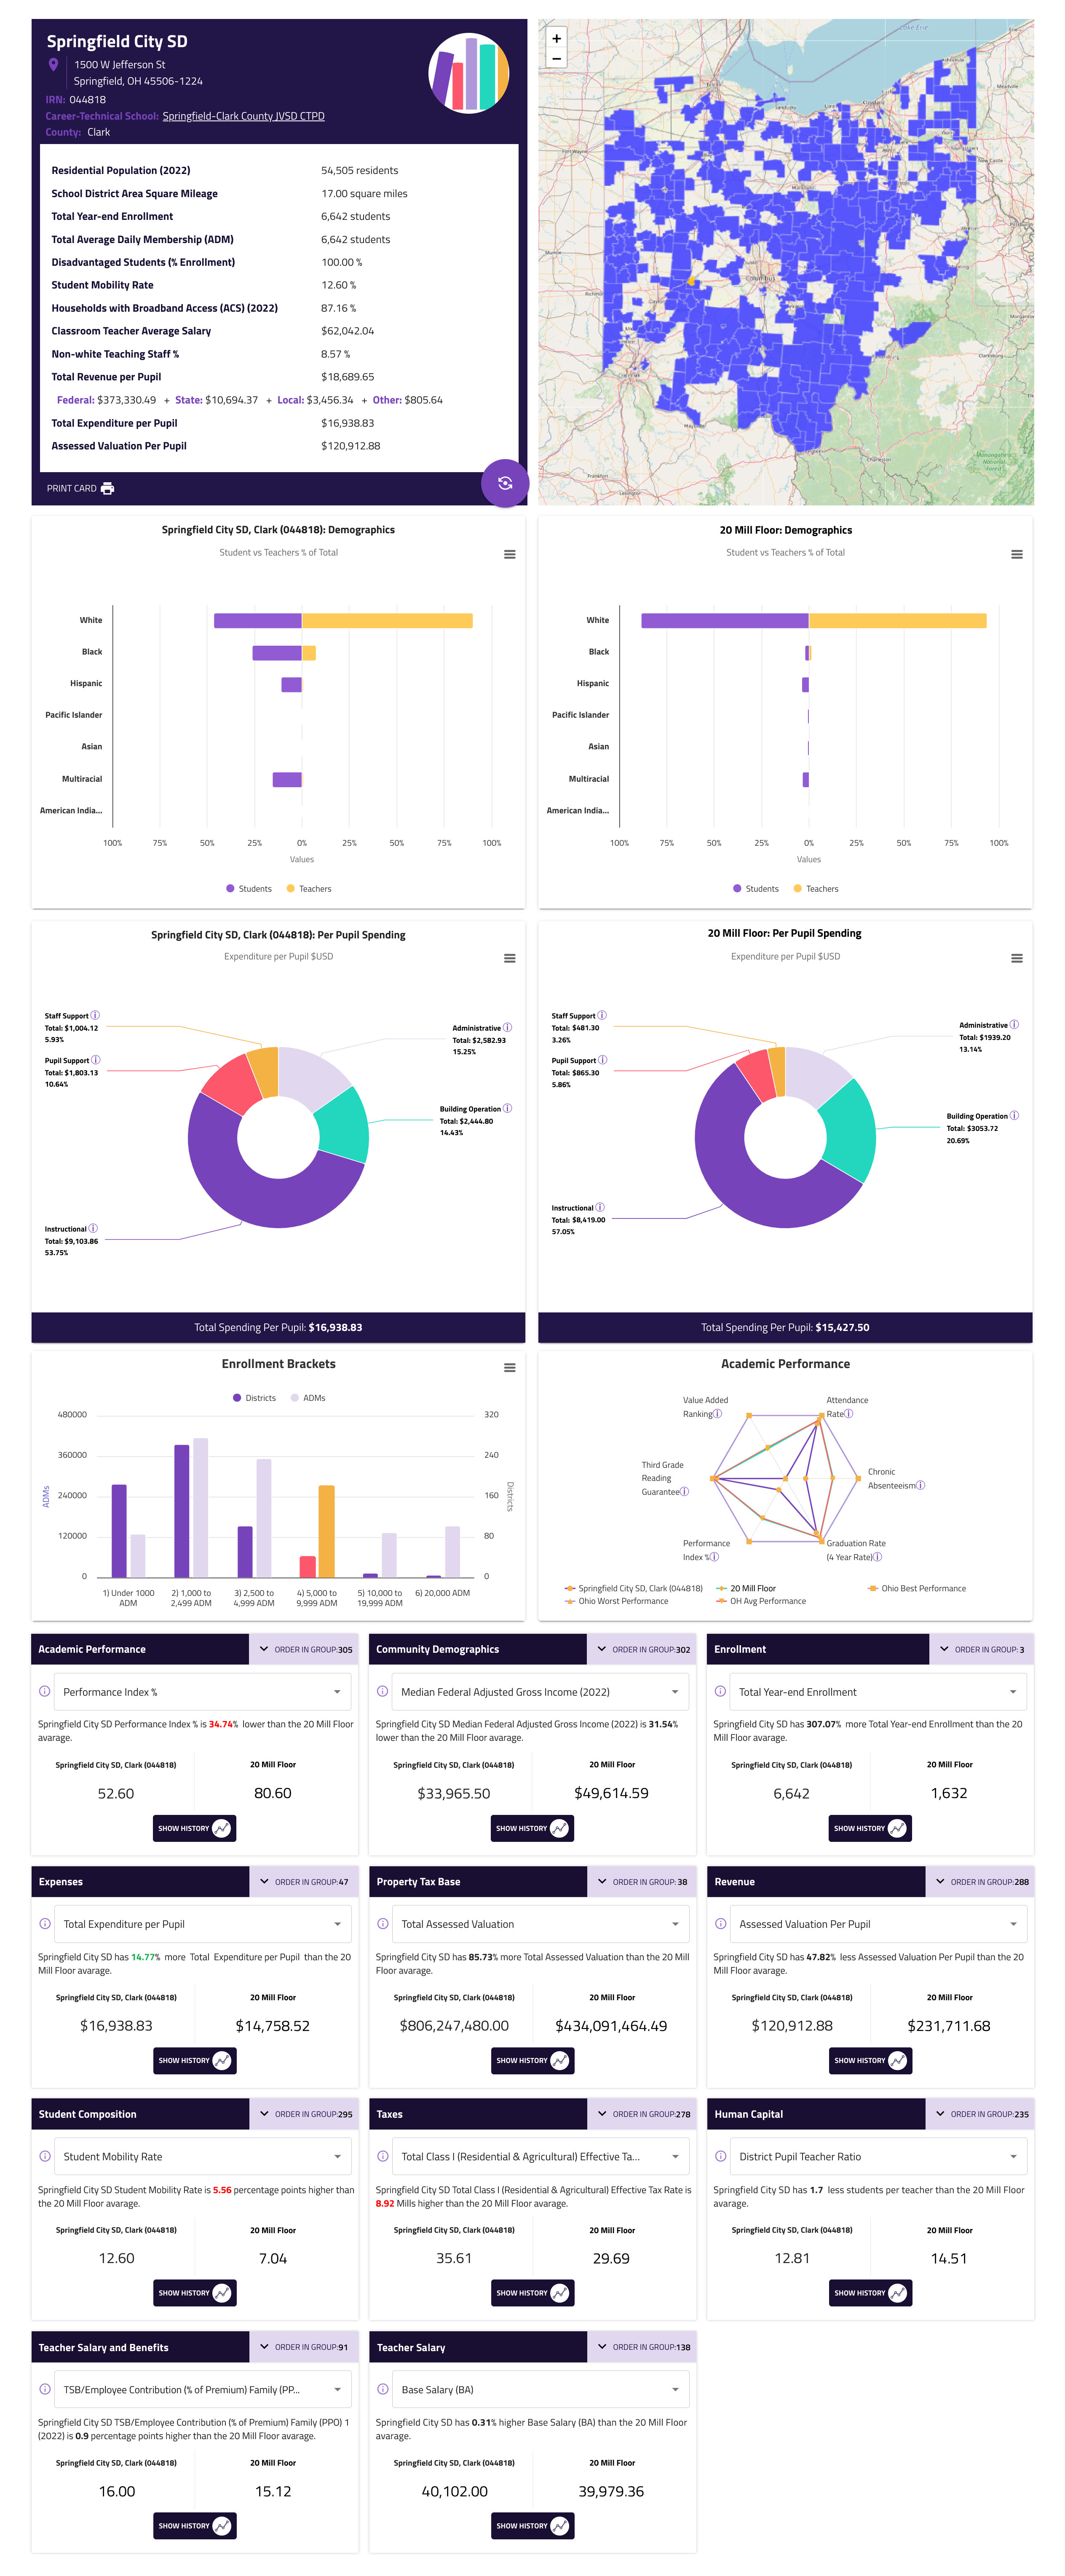
InsightBoard analytics compares staffing, student, and operations data across demographics, performance, taxation & revenue, elections, human capital, and spending for every District in Ohio.
Ohio Data Town Hall
Join us Wednesdays and Fridays at 1 PM.
We'll review the InsightBoard and discuss how to advance what's possible in using data to drive insights that improve your district's operations and increase outcomes for kids.
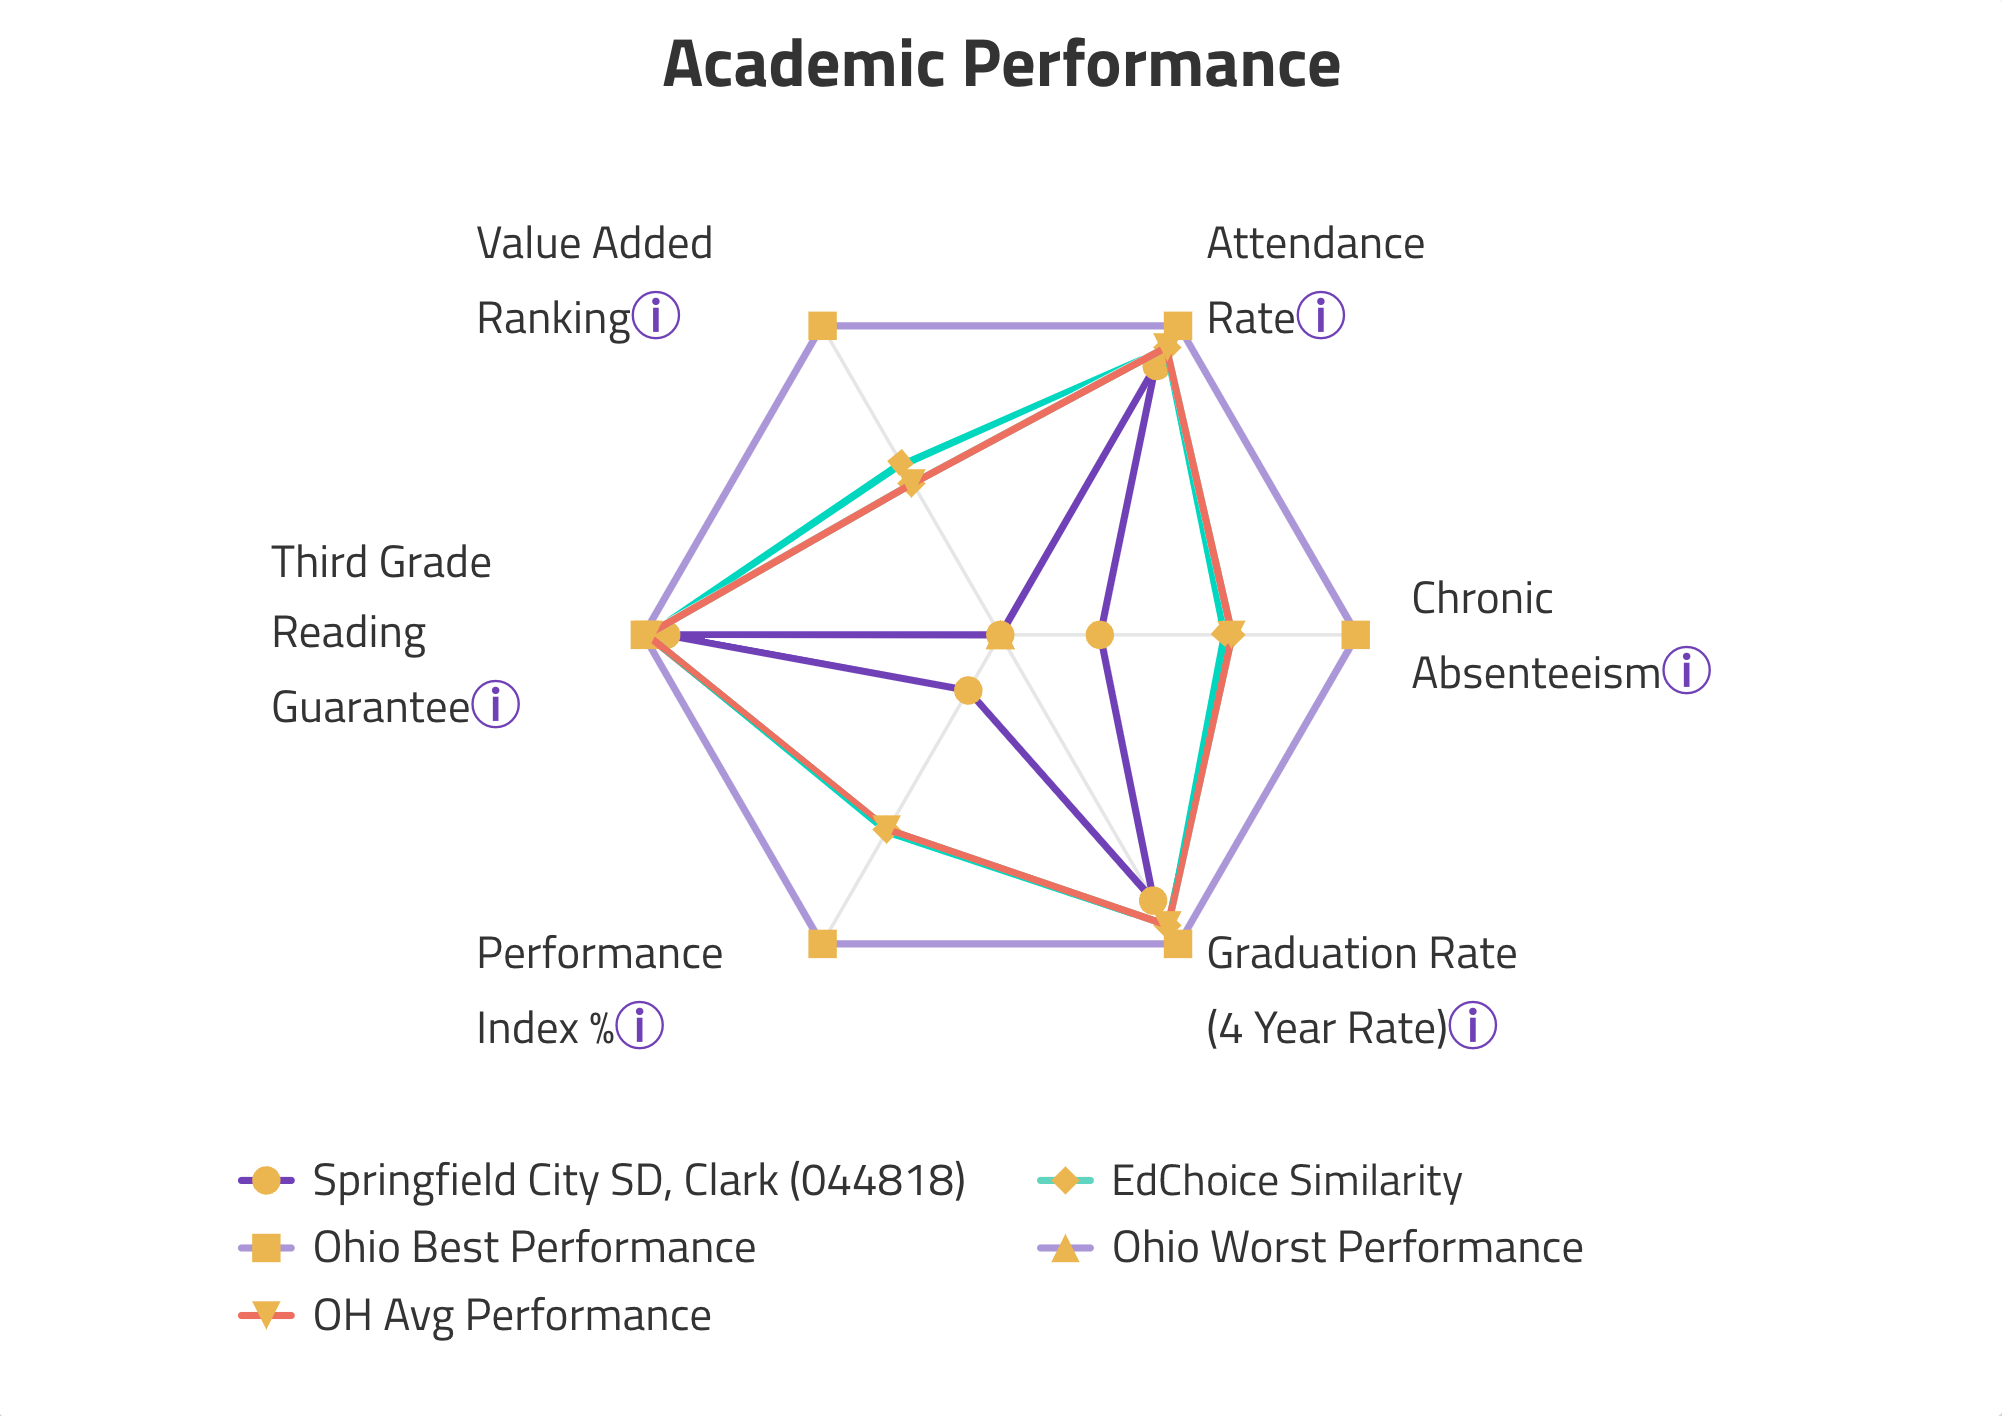

Discover the data behind your Ohio Report Card
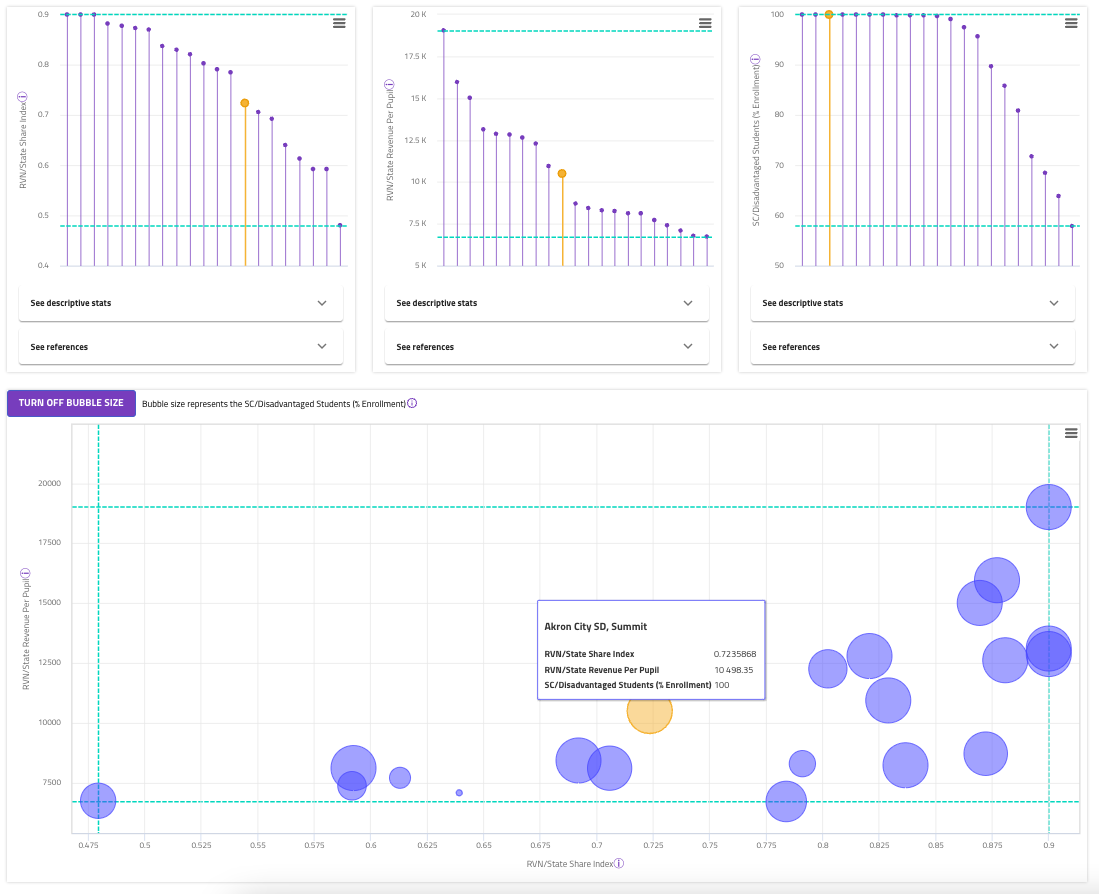
InsightBoard school analytics gives instant access to a complete 360° view of your district data. Compare your district across multiple years to any other district, any group of districts, or the state.
District Insights
Comprehensive district profile at a glance, readily compare your district to any district, grouping or the entire state.
District Insight Groups
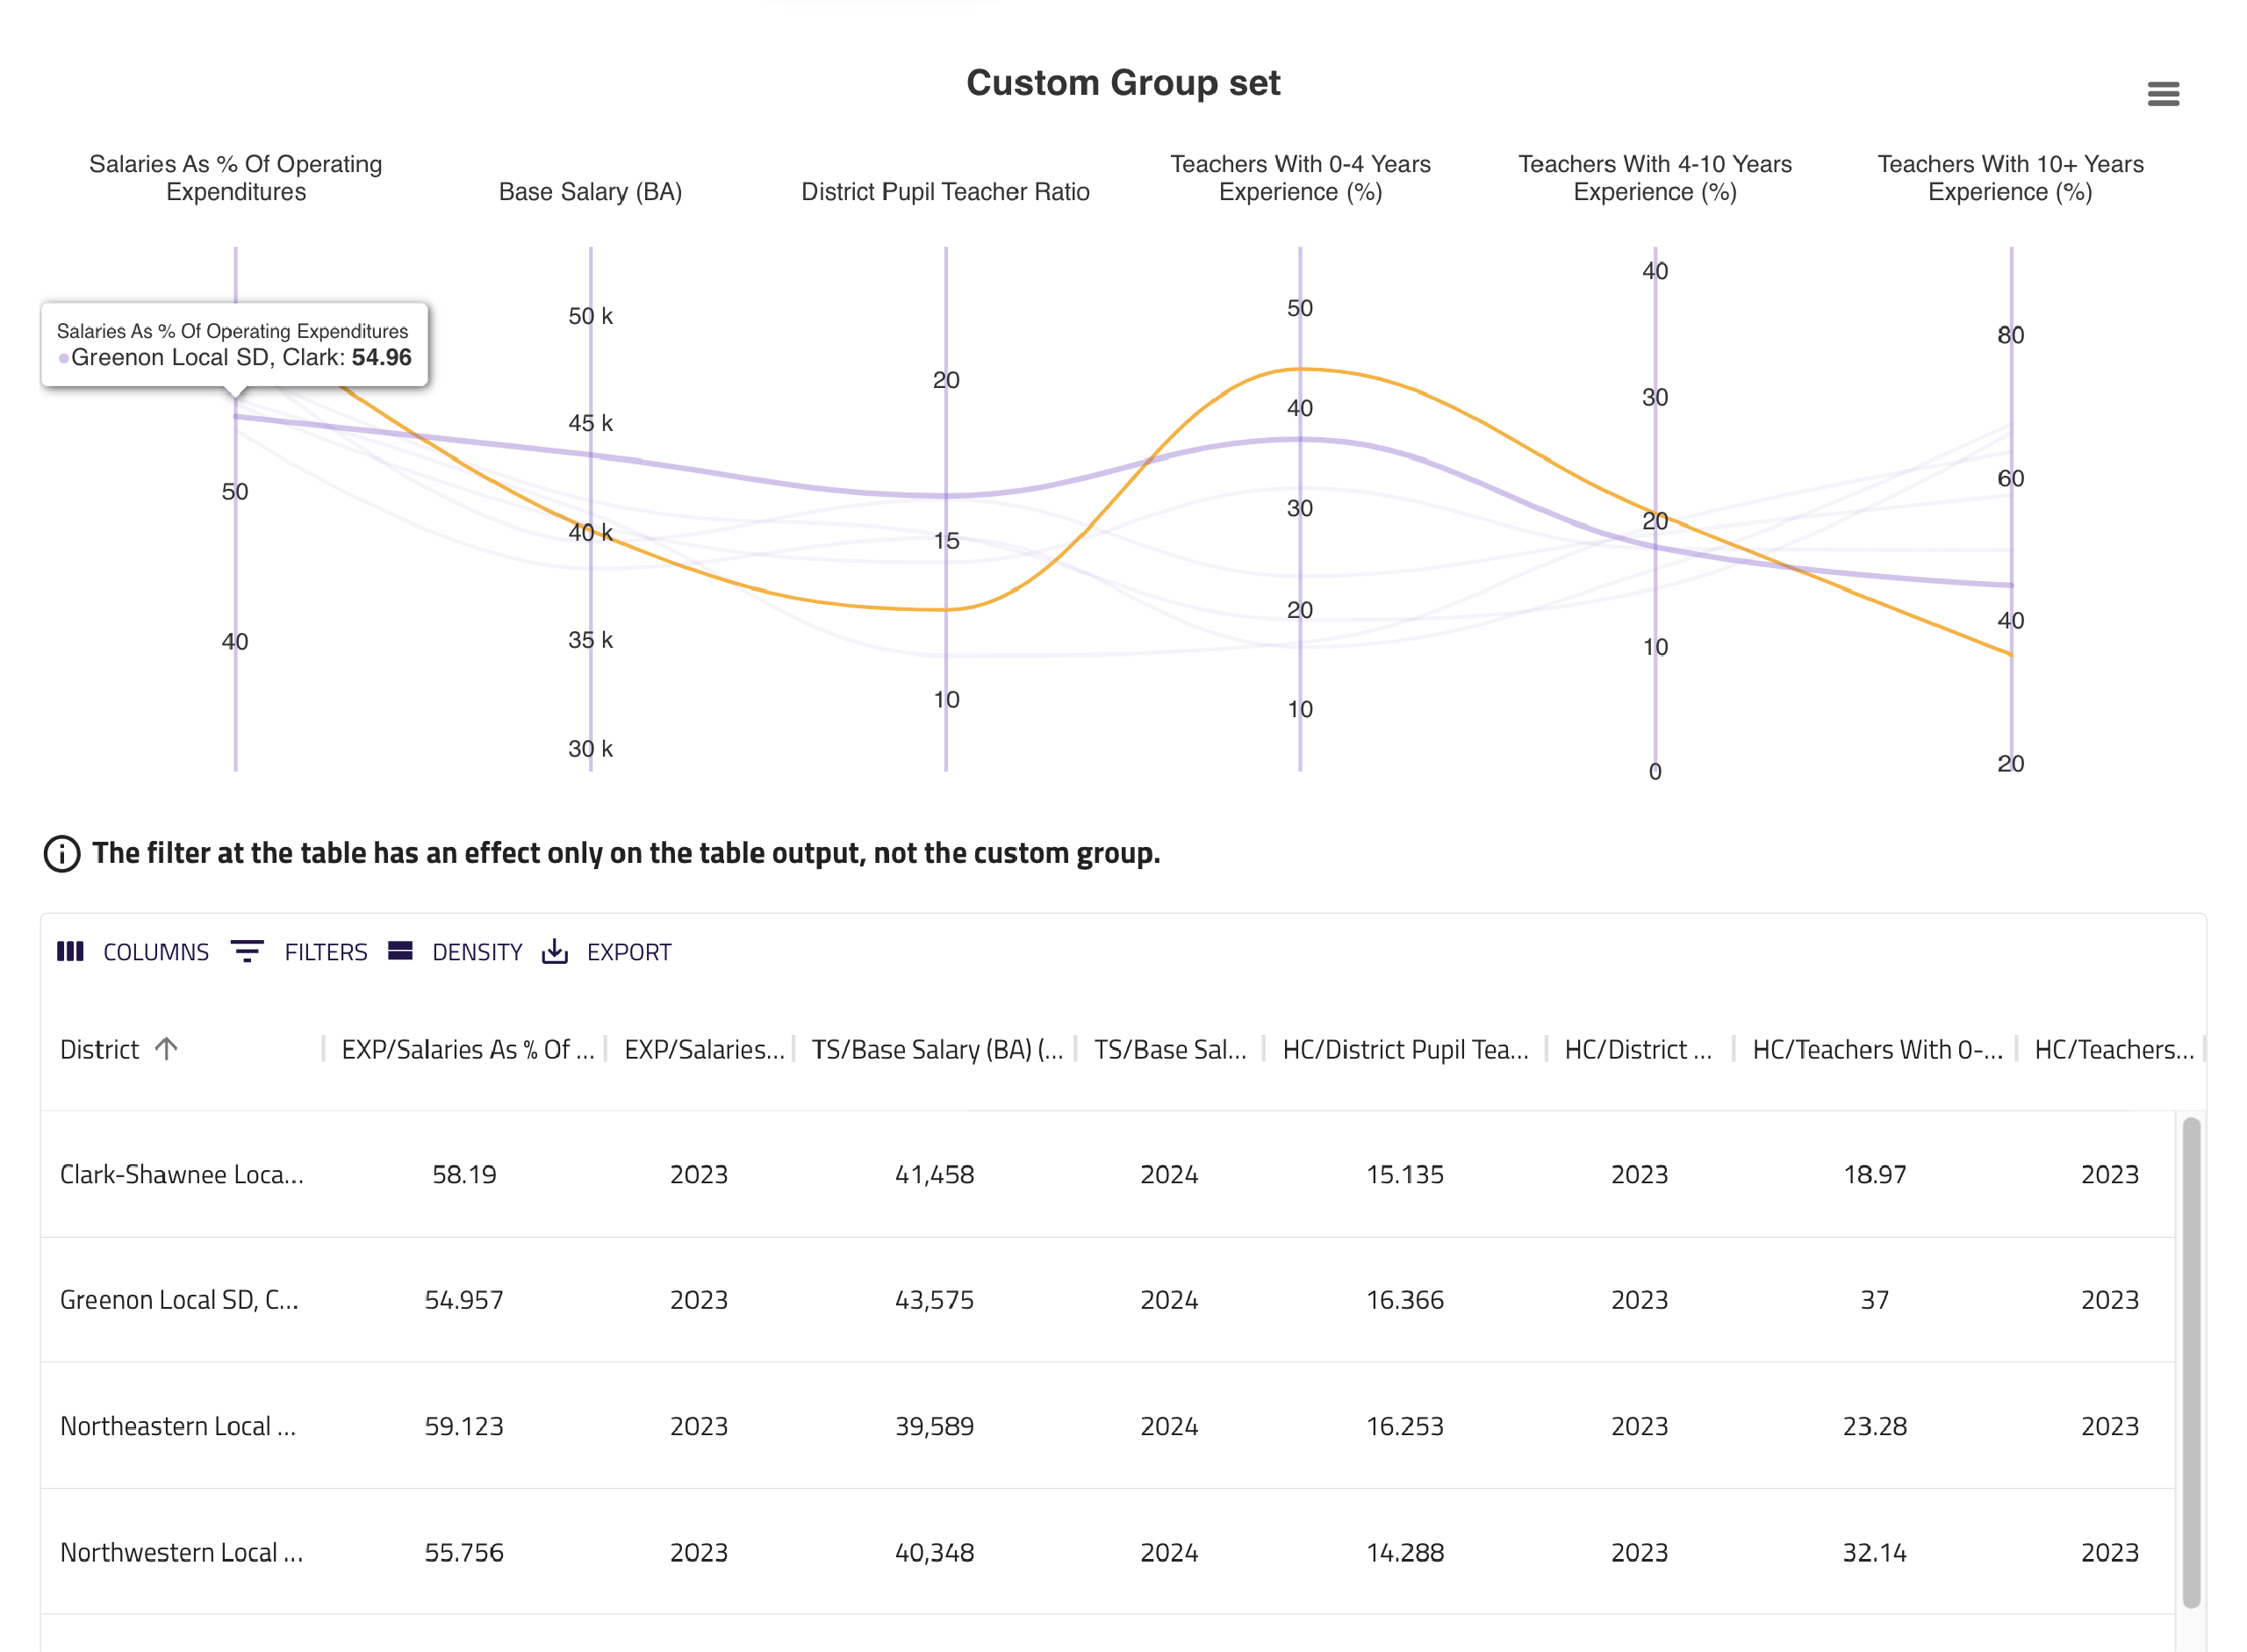
Create comparisons among all measures from custom defined groups of districts around key indicators.
Employee Insights
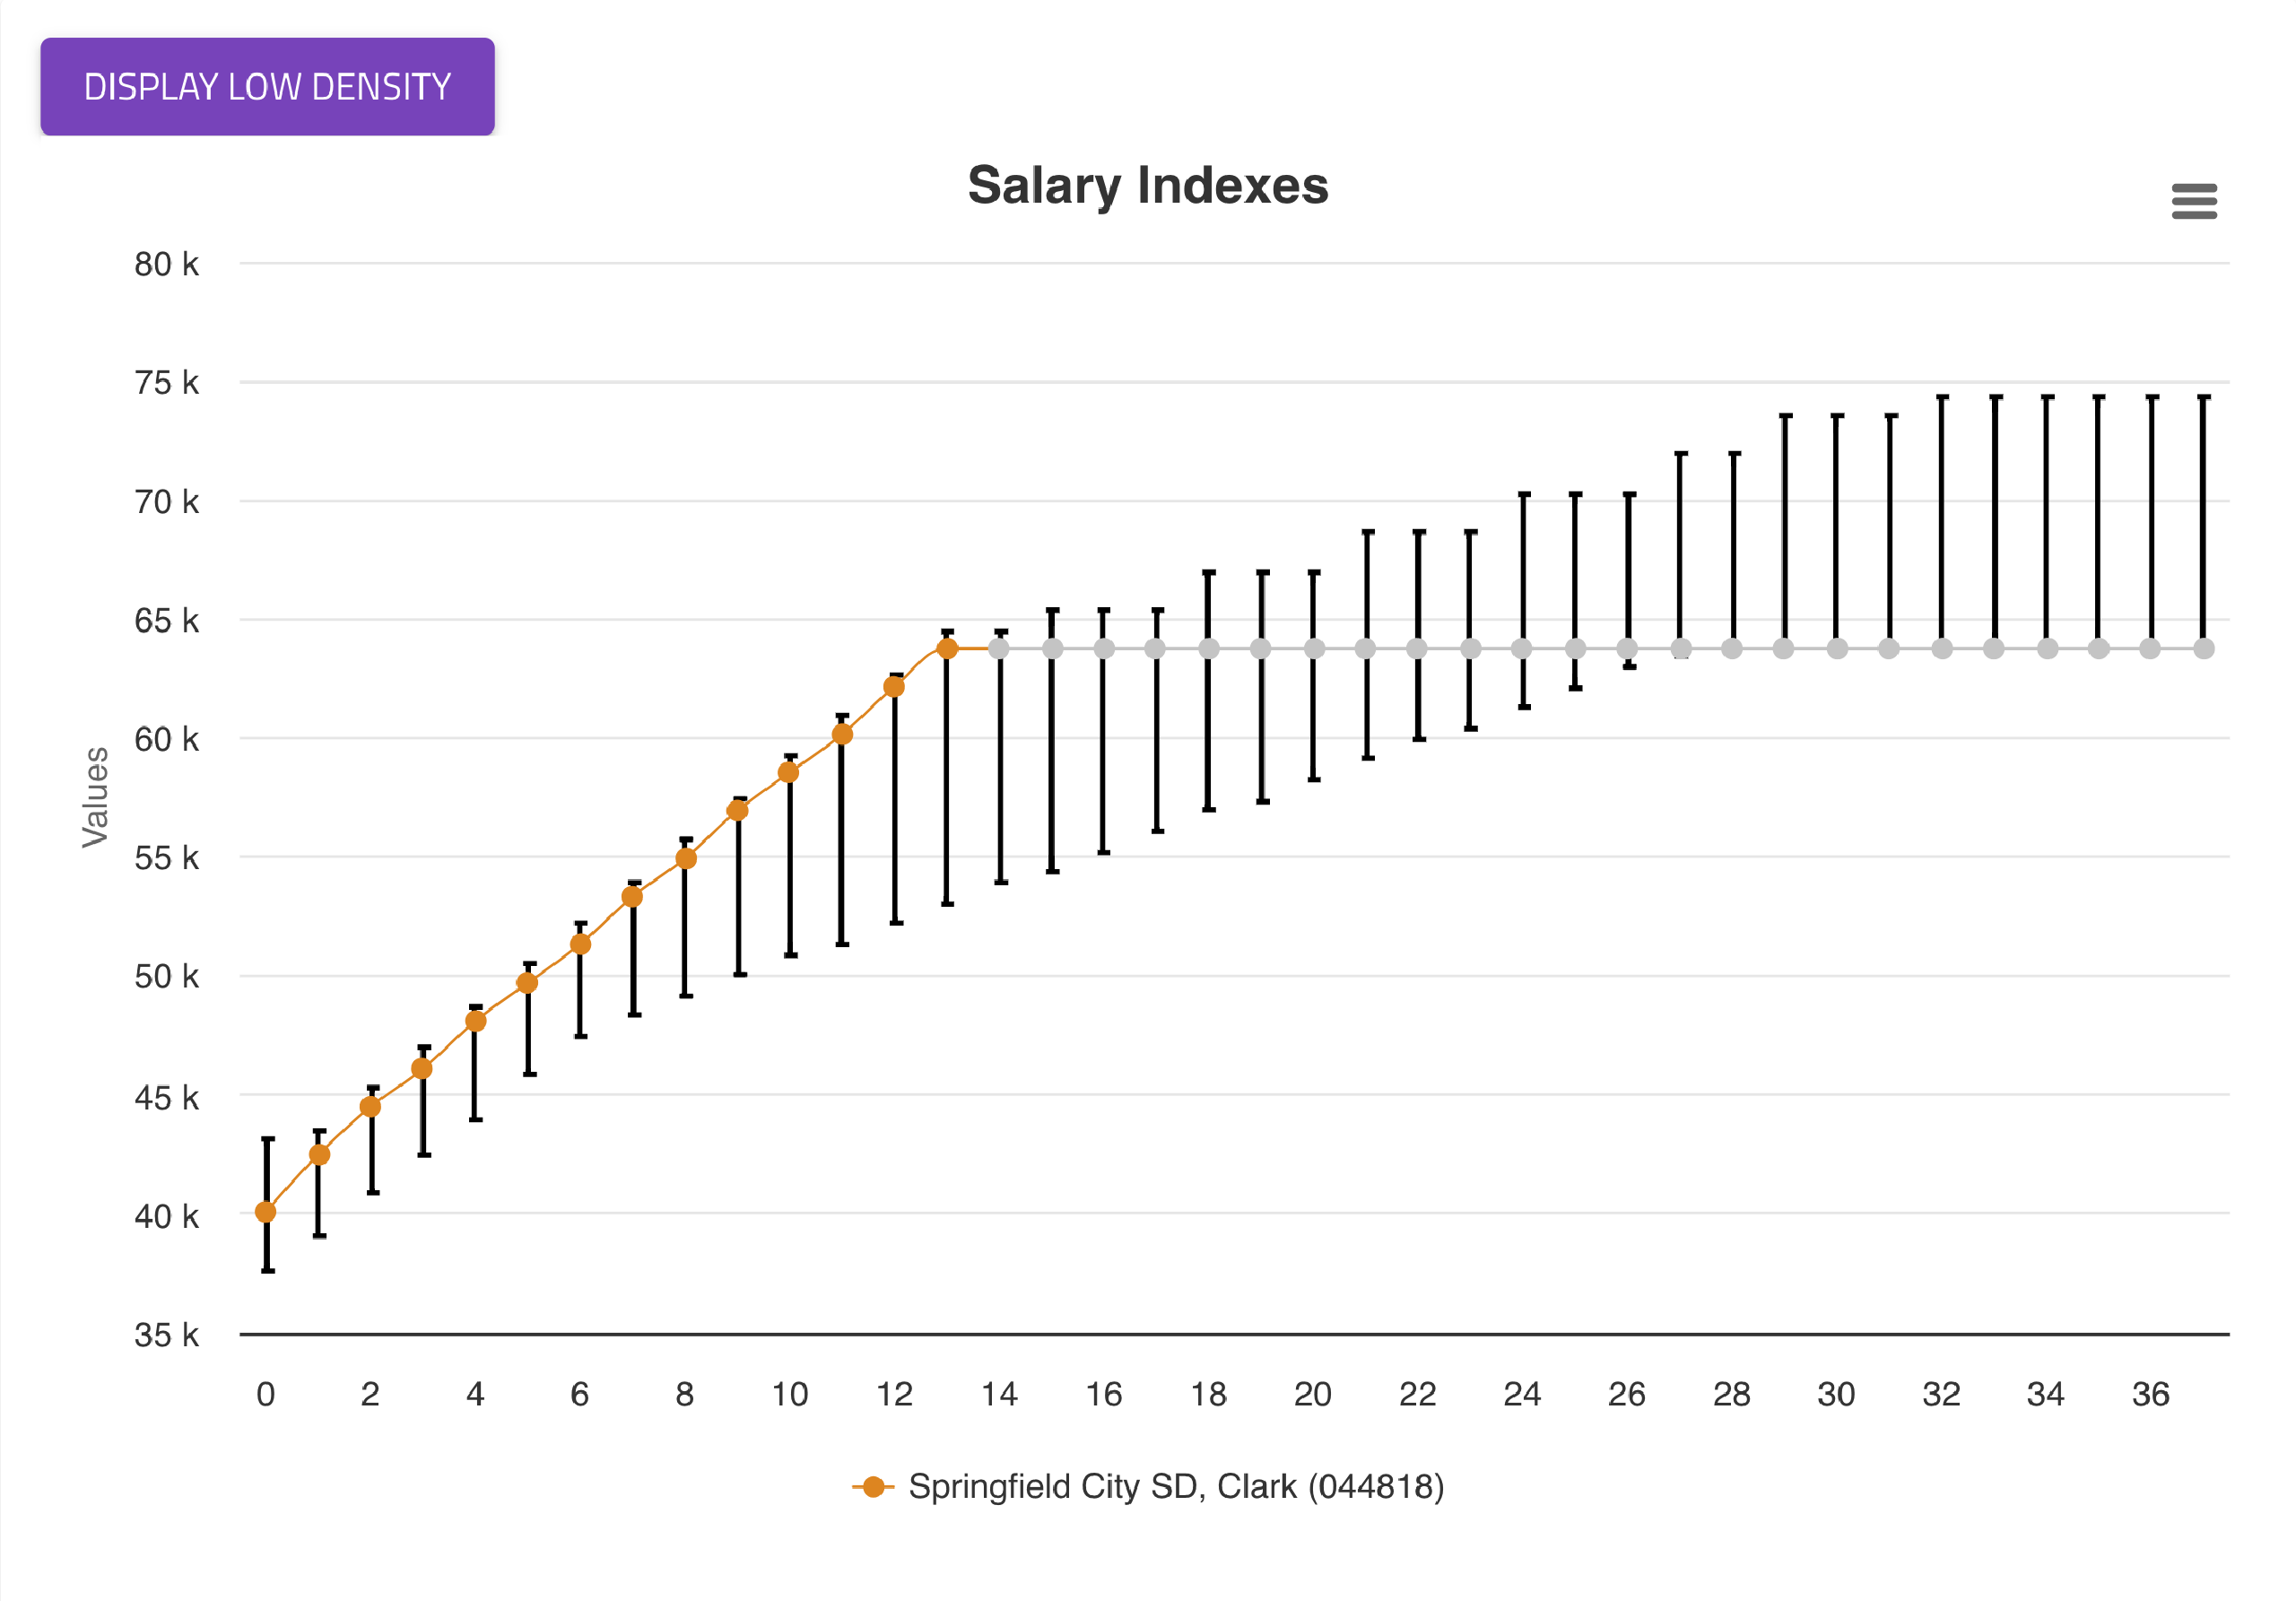
Visualize how your compensation compares to any district, across your local counties, even any group of districts or the entire state.
We created InsightBoard to:
/ Provide actionable insights at a glance to district leaders and policymakers to serve the education community.
/ Level the playing field.
/ Help kids and their families.
We built this tool to create a community around surfacing opportunities to elevate the impact of public education.


